
All of these graphs were created in Colab.
I’ve actually never found a commercial product that does everything I want, so I figured I’d build one up in a series of blog posts. We’ll see how many I get through! 🧵👇
First, we’ll get SPY’s stock history with pandas_datareader.
import pandas_datareader
df = pandas_datareader.data.DataReader(
    'SPY', 'yahoo', start='2020-05-01')
This returns a dataframe that looks like this (as of this writing):

If we plot the High and Low columns (_ = df[['High', 'Low']].plot()), we get:
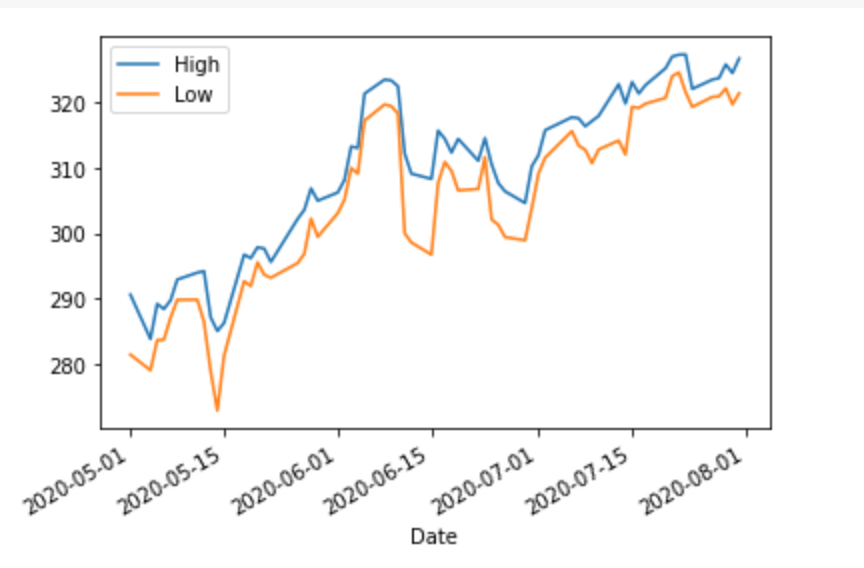
Now let’s throw in an actual portfolio. Let’s say I bought stock on the first of each month at some random point between the high and low:
import numpy as np
# Get the prices at the first day of each month.
first_of_the_month = df[df.index.day == 1]
my_portfolio = (
    first_of_the_month
    # Choose a random number between the day's high and low.
    .apply(lambda x: np.random.randint(x.Low, x.High), axis=1)
    .rename('cost_basis'))
my_portfolio
Date
2020-05-01 282
2020-06-01 304
2020-07-01 310
Name: cost_basis, dtype: int64
Let’s say that we have $1000 to invest each month (and our broker supports buying partial shares). So we can invest the following amounts each month:
my_portfolio = my_portfolio.assign(
    # Get the number of shares purchased this month.
    shares_purchased=1000/my_portfolio.cost_basis,
    # Get all shares I own so far.
    total_shares=lambda x: np.cumsum(x.shares_purchased),
)
my_portfolio

Finally, we want to add that back into the ticker info and plot it (let’s go with “Close” as the value for each day):
df = (
    df
    # Combine my_portfolio with the stock ticker.
    .assign(shares_owned=my_portfolio.total_shares)
    # Fill in the # of shares owned per day.
    .fillna(method='ffill')
    # Portfolio value = number of shares * price
    .assign(total_shares=lambda x: x.shares_owned * x.Close)
)
_ = df.total_value.plot()
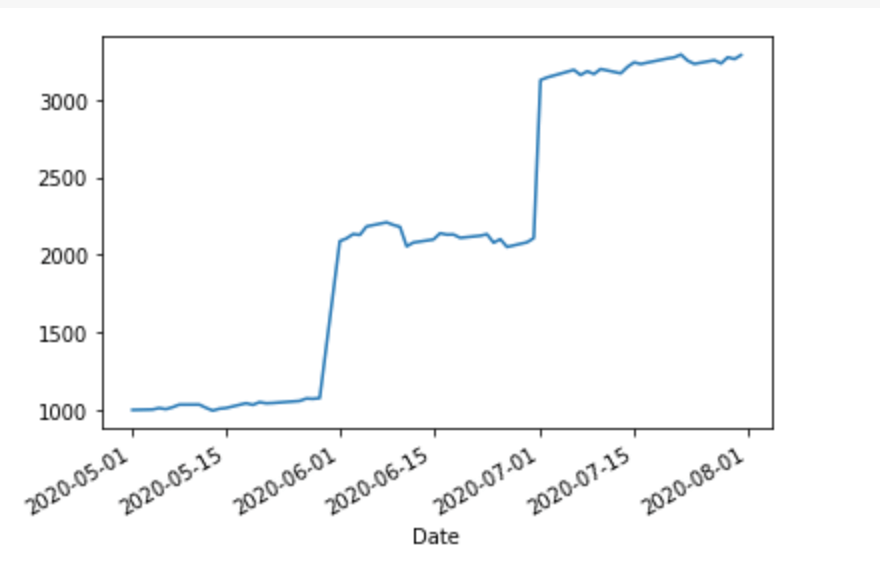
Looks a bit less impressive than the S&P 500 graph. Let’s compare it to keeping our money in cash:
my_portfolio = my_portfolio.assign(cash_pos=range(1000, 4000, 1000))
df = df.assign(cash_pos=my_portfolio.cash_pos).fillna(method='ffill')
_ = df[['total_value', 'cash_pos']].plot()
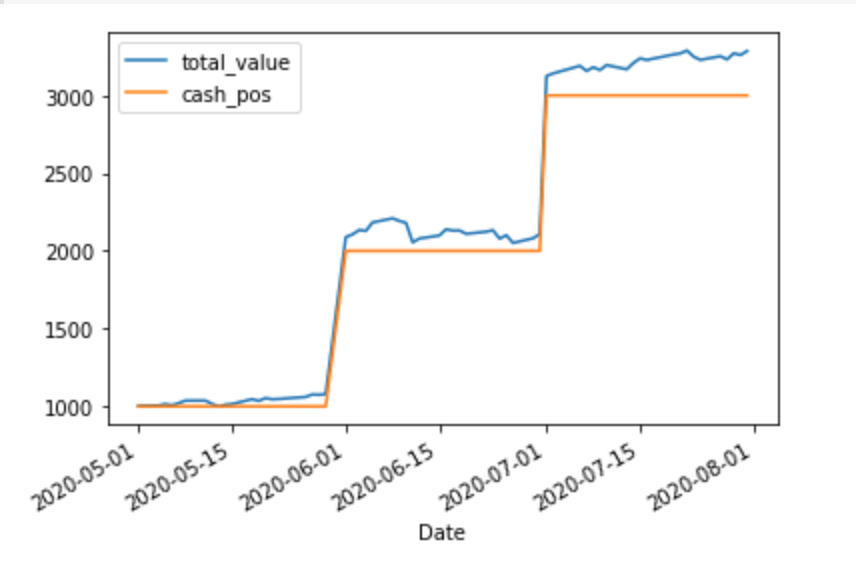
We can see that our portfolio is doing better than an all-cash position almost immediately. However, there are a couple of things I’d like to add:
- A real portfolio might have more than one stock. I want overall performance, plus broken out in different “sub-portfolios.”
- At least for me, it’s not good enough to beat cash, I want to beat a benchmark (e.g., return at least 4%/year).
Let me know any other features you wish your broker supported in the comments and I may (or may not 😅) implement them.
On the other hand, this is a quote I’ve been thinking about a lot as I strategize about my portfolio:
We are all at a wonderful ball where the champagne sparkles in every glass and soft laughter falls upon the summer air. We know, by the rules, that at some moment, the Black Horseman will come shattering through the great terrace doors, wreaking vengeance and scattering the survivors. Those who leave early are saved, but the ball is so splendid no one wants to leave while there is still time, so that everyone keeps asking “What time is it? What time is it?” But none of the clocks have any hands.
-Adam Smith (not that one)

3 thoughts on “Building a (very simple) portfolio tracker with pandas”